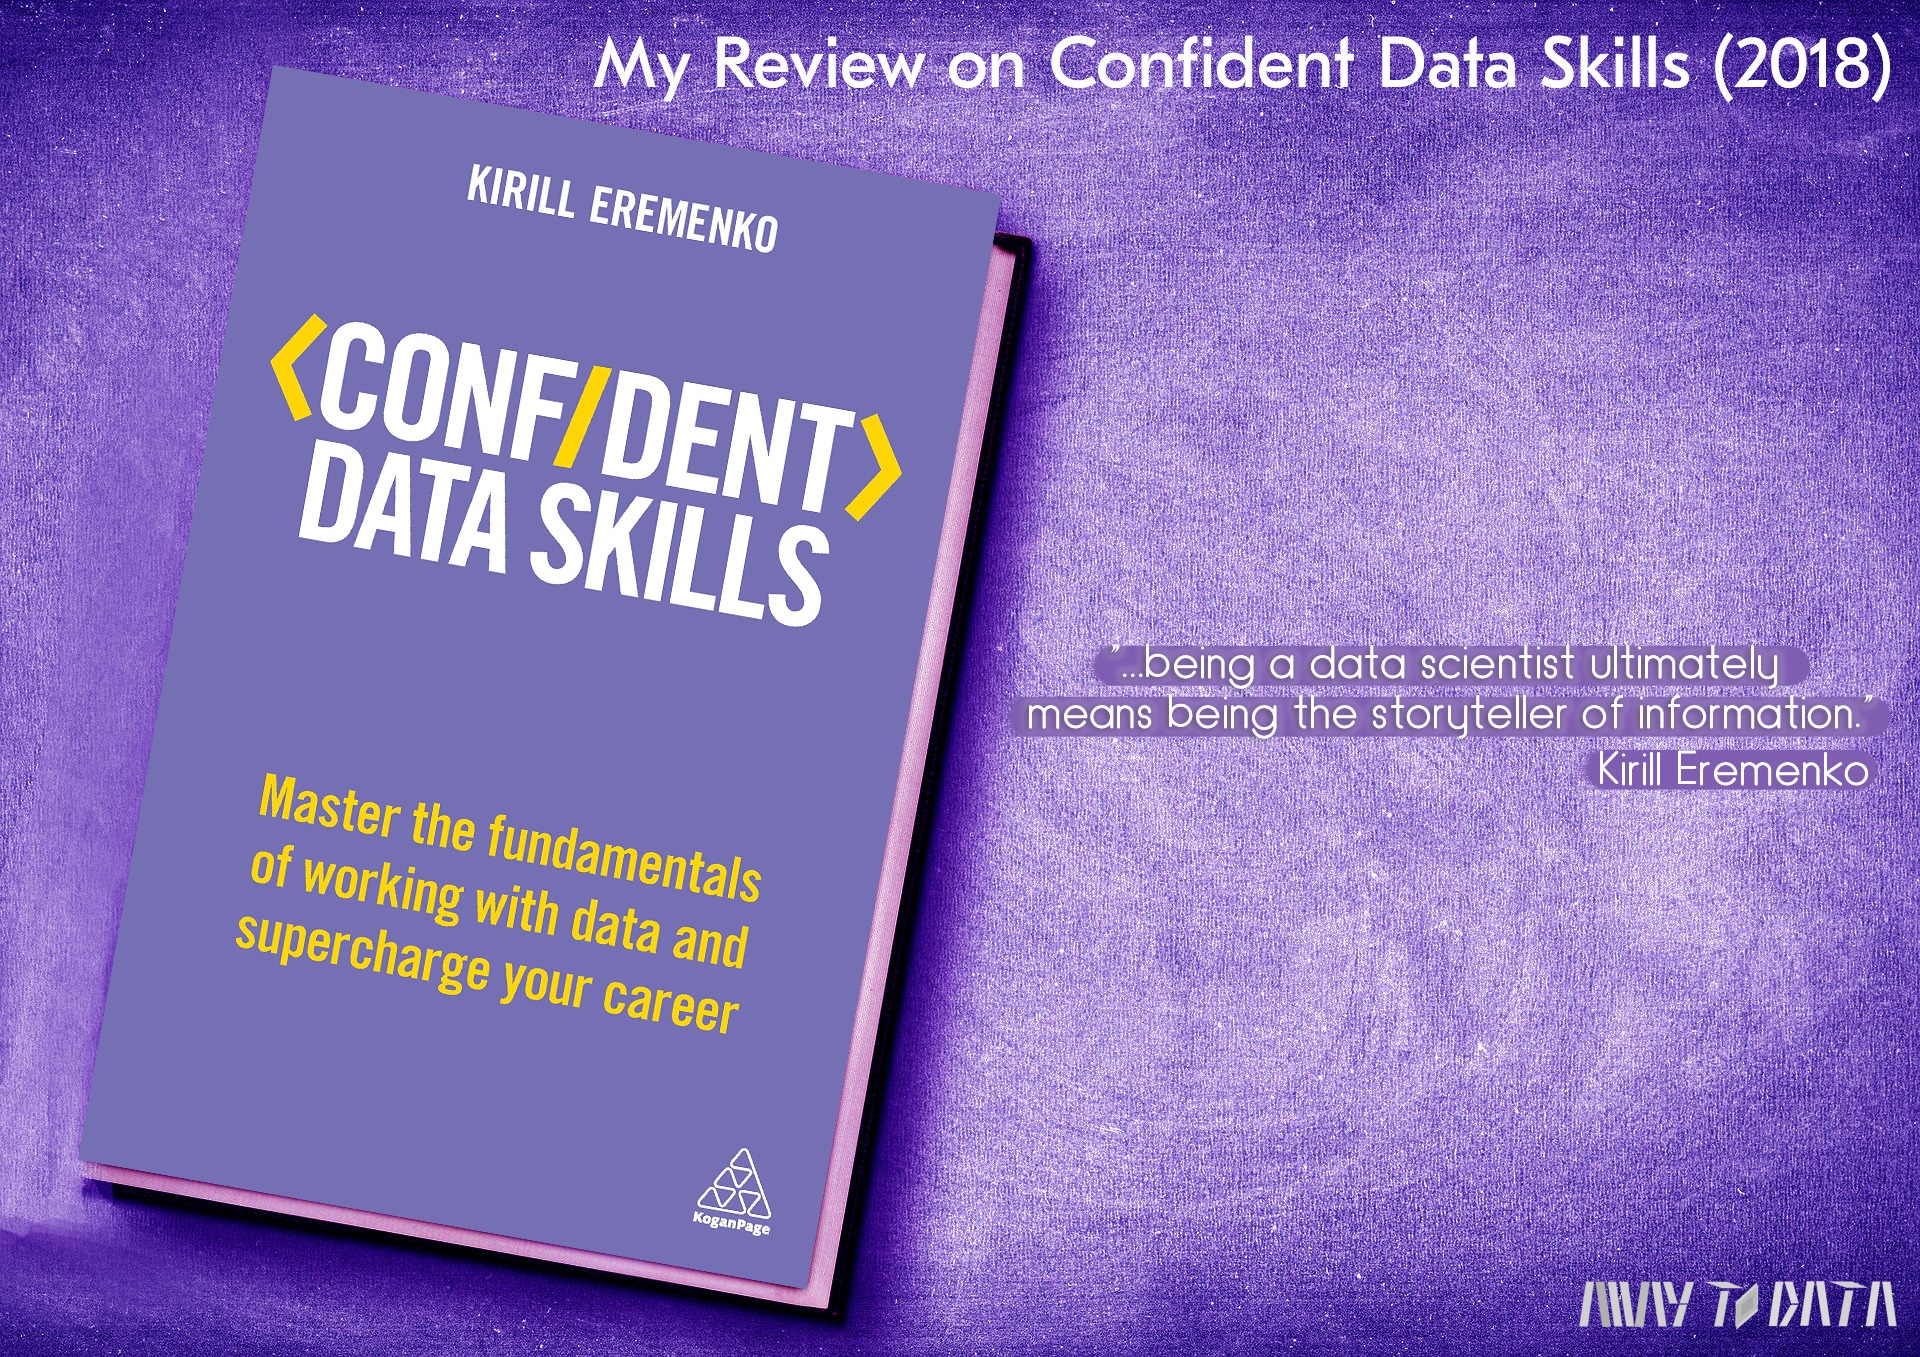
My Review on Confident Data Skills (2018) by Kirill Eremenko

Recently, I was invited to become an ambassador of Yandex.Praktikum, I have joyfully accepted the invitation, and because I love writing I joined a blogging marathon among a subgroup of ambassadors, sadly, it didn’t get supported by many but I prepared this review. A part of it was written 2 years ago, my highlights from the book have been kept publicly and privately on goodreads, so I decided to elaborate the review by adding them to the first version.
I learnt a lot from Kirill as I also took some of his courses previously (R A-Z, Python A-Z), watched streams and even a DataScienceGO conference. So it was a pleasure to get to know him better in the introduction chapter where he shares his background story, it was really surprising that he grew up in South Africa, for example.

Confident Data Skills is a great introduction guide to understand what it means to be a data analyst and data scientist, how to become one, what they do and what their actual task is, which is to ensure that stakeholders understand the outcome of analysis, the required following actions and their costs or as he put: being a data scientist ultimately means being the storyteller of information. As much as I like writing code, I enjoy writing in general, my code writing skills were poorer 2 years ago, so this quote alone brought me hope back in that time.
The author explains well that we need analytics everywhere with case studies within Maslow’s Hierarchy of Need.
As a nota bene: the even better news is that data will not deny you your interests. If you’re only playing at being the connoisseur but still enjoy a trashy zombie movie once the curtains are drawn, your data will continue to keep that secret enthusiasm of yours fed.

He also seeks to clarify general misconceptions one may have.
The machines are not telling us what we want; they are making connections for us that we could not possibly have known.
The book will guide you on how an analysis is performed (the whole process generally), some analysis techniques, intuition behind them, statistics and personal tips on which tools to use in different cases, and visualization techniques. The data science process
- Identify the question
- Prepare the data
- Analyze the data
- Visualize the data
- Present your findings
He has convinced me to appreciate the value of graphics as I had appreciated the value of numbers more than plots (which is probably a weird thing to claim considering that I’ve worked as a graphic designer, yet, numbers are important, there’d be no graphs, hah!), so it was in a way eye opening cause a great analyst should not underestimate the importance of presentation skills and it’s more than writing code, as one should aim to make plots as clear and intuitive as possible. It was one the plot twists of my life.

Carrying out BI might seem unsophisticated, … but dismiss it at your peril; I don’t know a single executive who would genuinely prefer to read a 50-page report over a visual representation of the problem and its solution. If visualized well, BI dashboards will engage and persuade your audience to make the changes that you suggest.
One will also find tips on where to start developing his or her skils and the career, and what one could expect in a job interview. I particularly enjoyed an example with questions like how many people have red cars in Australia where it’s important to show that one can reason to get to the answer instead of demonstrating the knowledge of facts, if one even possesses it.