How to Display Any List of Geolocations on a Map in Google Earth
Let’s say you need to display a number of different locations on a map. I would like to visualize where the Airbnb rentals under $30 in Berlin are located. Besides listings data from InsideAirbnb, I am going to need RStudio packages (data.table, tidyr, and R.utils), Google Earth Pro (download and install it, if you don’t have it yet), and online CSV to KML Converter. If your data are ready, then you can just skip the first part.
Getting Data in Shape
setwd(”…”) #setting the working directory to find the listings file
library(data.table) #to read big files quick
install.packages(“R.utils”) #to read .gz files right away
Berlin <- fread(“Berlinlistings.csv.gz”) #the filename has been changed
colnames(Berlin)
which(colnames(Berlin)==“name”) #to find the column to export
which(colnames(Berlin)==“latitude”)
which(colnames(Berlin)==“longitude”)
which(colnames(Berlin)==“is_location_exact”)
which(colnames(Berlin)==“price”)
Berlinlocation <- Berlin[,c(5,49,50,51,61)]
str(Berlinlocation)
library(tidyr)
Berlinlocation <- separate(Berlinlocation,col=price,into=c(“sign”,“chprice”))
Berlinlocation <- data.frame(Berlinlocation, price = as.numeric(Berlinlocation$chprice))
Berlinlocation <- Berlinlocation[,c(-5,-6)] #delete odd columns
berlinlocation <- subset(Berlinlocation, price <= 30 & is_location_exact == “t”)
write.csv(berlinlocation[,-4],“berlinlocation.csv”) #save without the is_location_exact column
functions used: fread (data.table) to read big files, separate (tidyr) to delete the $ sign before the price in order to subset the data with needed filters (exact location and price below $30).
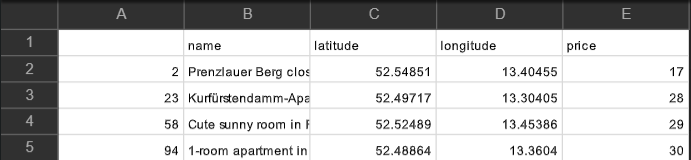
As a result, I got the .csv file that contains the 4 selected columns: name, price, geolocation coordinates (latitude, longitude) and 4495 rows/listings.
Here’s an example of what a file should be like, the order of the columns doesn’t matter.
Creating a .KML file from .CSV to visualize
Here’s an example of what a file should be like, the columns’ order doesn’t matter.
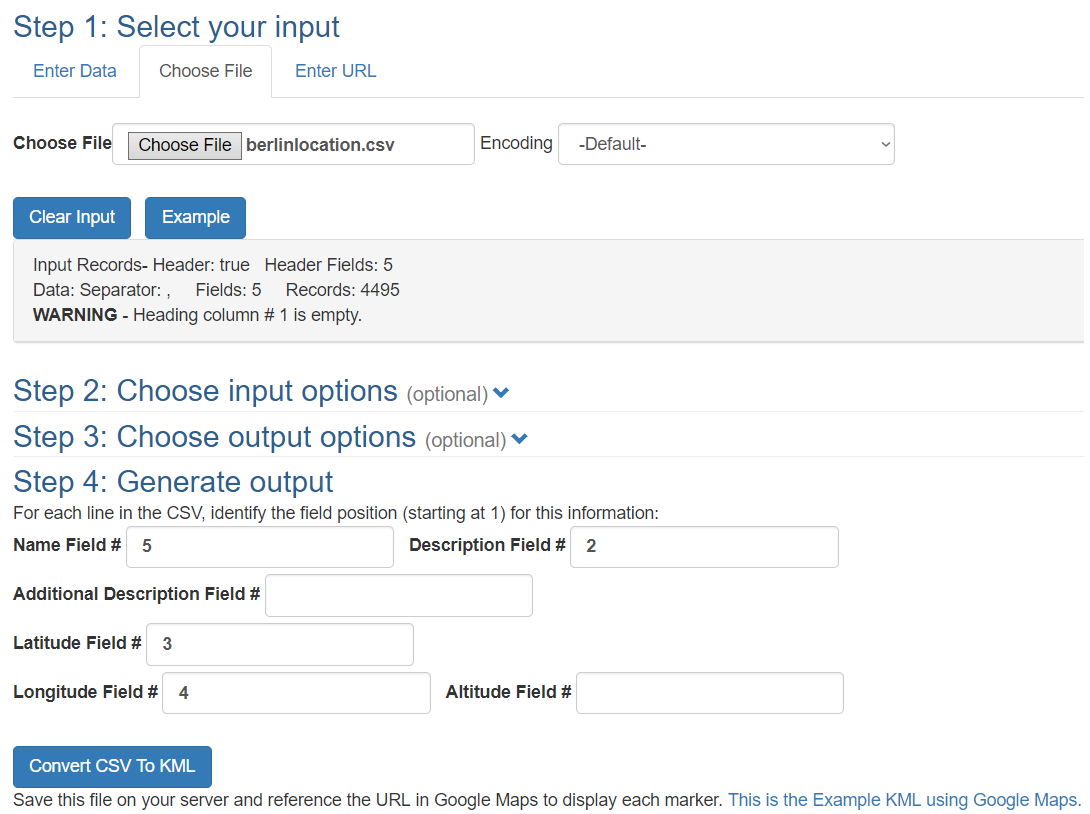
The next step is to convert the .csv file into a .kml (Keyhole Markup Language) file with free CSV to KML converter. After choosing .csv file, I take price as Name Field, that will allow me to see price on the map, the price column number is 5 (column E) in .csv, and what happens when I click on a data point? We’ll see its description, therefore the description field is going to be the name column of a listing in the data, it comes second (column B), so one will be able to see prices before the names.
Highlighting locations from the dataset on the map
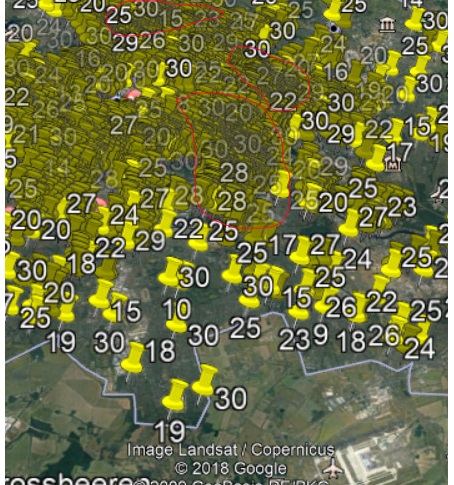
Now the final step is to launch the newly generated and downloaded KML file on Google Earth.
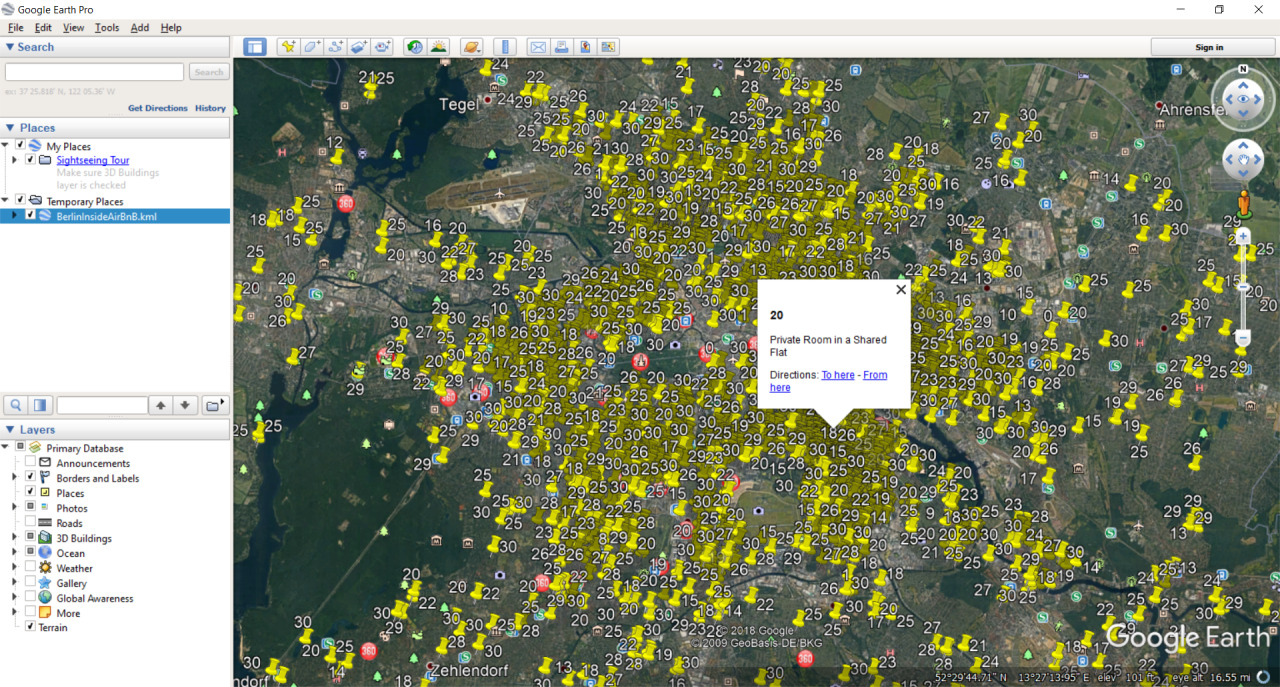
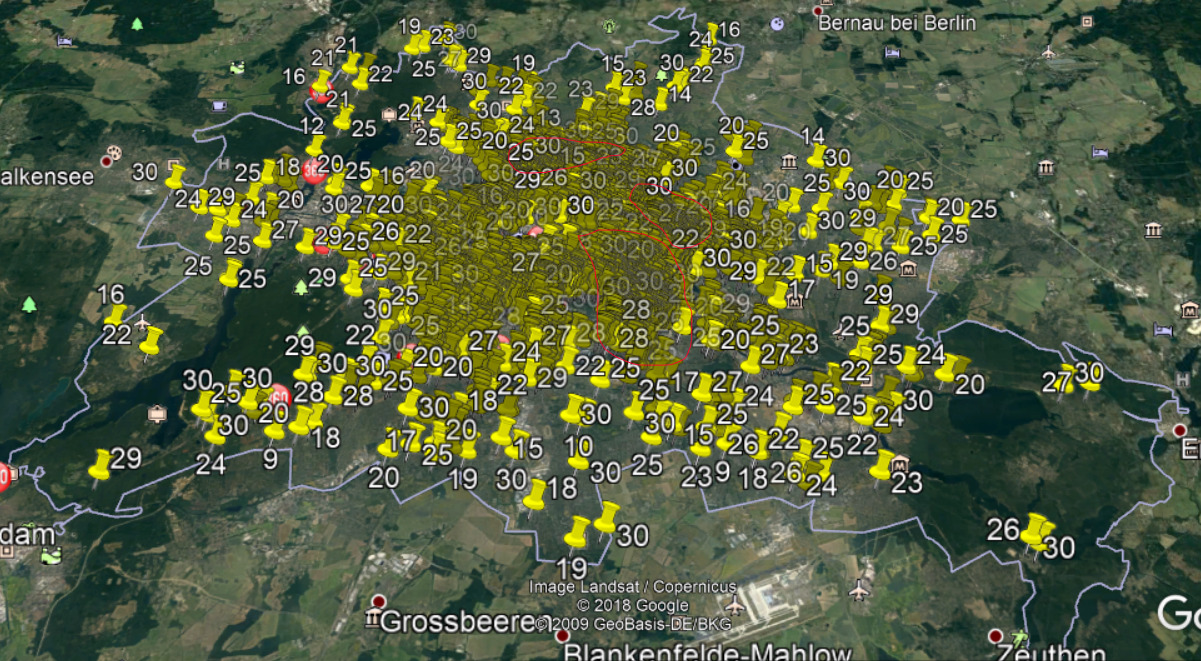
One can conclude that density of Airbnb listings under $30 in East Berlin is higher than in the city’s Western part, it should be related to the history of the city.
If you want to launch the files, you can get them here.
P.S. Obviously, it doesn’t matter whether you need to highlight the points on a city, country, or cross-country level as long as you have the coordinates and Google Earth Pro. Have fun and let me know if it helped! I will be happy to know that.